Profiling Phoenix on a Raspberry Pi 2
I've been talking a lot recently with colleagues (and anyone foolish enough to ask) about the benefits of Elixir, based on the performance of the underlying Erlang Virtual Machine (BEAM).
One of the things I'm most impressed with is the ability to utilize as many processor as you can throw at it. The other thing that makes it compelling is the extremely small memory requirements.
I decided to see how much performance I could squeeze out of a Raspberry Pi 2.
Why a Pi?
A Raspberry Pi 2 in Australia will cost around $48, and has a 4 core ARM processor and 1GB of RAM. As a hobby device it's pretty well priced.
I'm currently in the process of building a house and because of the location, I will be getting access to Fiber-To-The-Premises broadband. Like any good nerd, I'm beside myself with excitement about that extra bandwidth (though it's really latency that kills web browsing experience).
I currently host a bunch of pet project on rented servers 'in the cloud'. I want to know if a Raspberry Pi 2 connected to my NBN connection would be able to replace some / all of these.
Setting up
Installing Elixir on a Raspberry Pi requires a bit of perseverance and time.
I'm not going to go into too much detail, but at this point in time, it requires compiling Erlang from source (if you want the latest version), this took about an hour.
The Phoenix application I have installed on the Pi is a side project. The details aren't that important, but I'll be testing two different parts of the application.
Firstly, I'll look at performance service a single 'index.html' endpoint. This receives a request and returns a static file, no additional work is required.
The second will receive a request for a collection of records. These will be retrieved from a Postgres database and the converted into JSON using JA_Serializer. JA_Serializer is a library for outputting JSON API compatible responses - it's a great library, but slightly slower than straight Poison.encode! as there's a bit more work to do.
I'll be using a tool called wrk for benchmarking. It's a Lua based project which allows you to hit a specified endpoint, measuring things like throughput and latency.
I'll also use the Erlang observer and htop.
THE BIG CAVEAT
These are benchmarks, run under nearly ideal conditions. They aren't going to provide a definitive answer to 'how much can I pump out of a Raspberry Pi?'. The results will give some indication of what's possible though.
A smaller one
The Raspberry Pi is connected to my router with a wired connection, the laptop driving the tests is connected via WiFi, so there's likely some impact on that as a result of latency and WiFi performance. I don't have any other data to compare, but it's worth keeping in mind.
Tests
1 thread, 1 connection, static endpoint
➜  mfeckie.github.io git:(master) wrk -d 30 -c 1 -t 1 http://192.168.1.12:4001/
Running 30s test @ http://192.168.1.12:4001/
  1 threads and 1 connections
  Thread Stats   Avg      Stdev     Max   +/- Stdev
    Latency     9.59ms   47.72ms 600.50ms   98.23%
    Req/Sec   268.20     22.84   292.00     90.14%
  7884 requests in 30.02s, 34.62MB read
Requests/sec:    262.61
Transfer/sec:      1.15MB
Looking at htop, we can see that we didn't even max out one of the cores
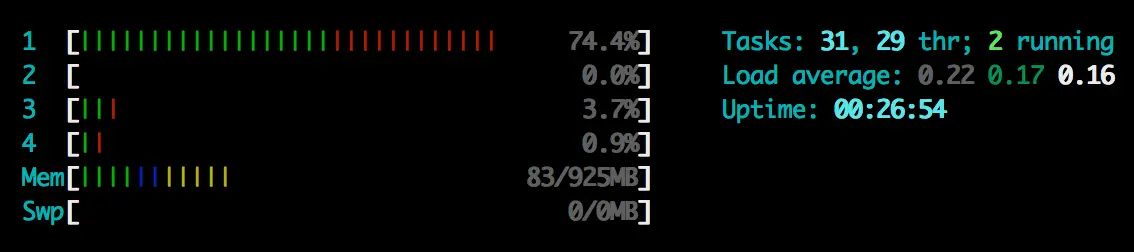
This is pretty decent performance, but using only 1 connection isn't really going to stress out the BEAM.
1 thread, 2 connections, static endpoint
➜  mfeckie.github.io git:(master) wrk -d 30 -c 2 -t 1 http://192.168.1.12:4001/
Running 30s test @ http://192.168.1.12:4001/
  1 threads and 2 connections
  Thread Stats   Avg      Stdev     Max   +/- Stdev
    Latency     4.99ms  773.42us  33.51ms   92.87%
    Req/Sec   401.21     16.94   460.00     75.67%
  12001 requests in 30.05s, 52.70MB read
Requests/sec:    399.31
Transfer/sec:      1.75MB
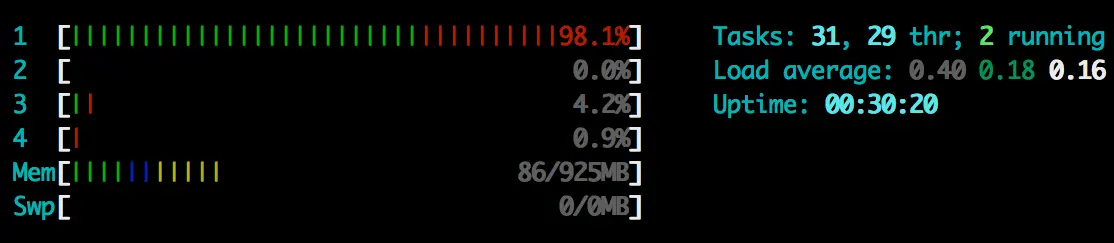
Looking at htop, we can see we've maxed out one core, but it looks like there's a lot more capacity.
8 threads, 8 connections, static endpoint
➜  mfeckie.github.io git:(master) ✗ wrk -d 30 -c 8 -t 8 http://192.168.1.12:4001/
Running 30s test @ http://192.168.1.12:4001/
  8 threads and 8 connections
  Thread Stats   Avg      Stdev     Max   +/- Stdev
    Latency     7.96ms    2.27ms  48.09ms   79.99%
    Req/Sec   126.02     13.26   170.00     57.08%
  30217 requests in 30.10s, 132.68MB read
Requests/sec:   1003.90
Transfer/sec:      4.41MB
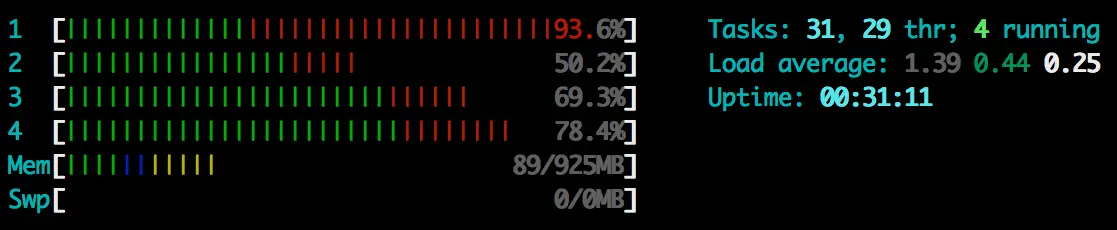
Now we're talking, using much more of the available processing power.
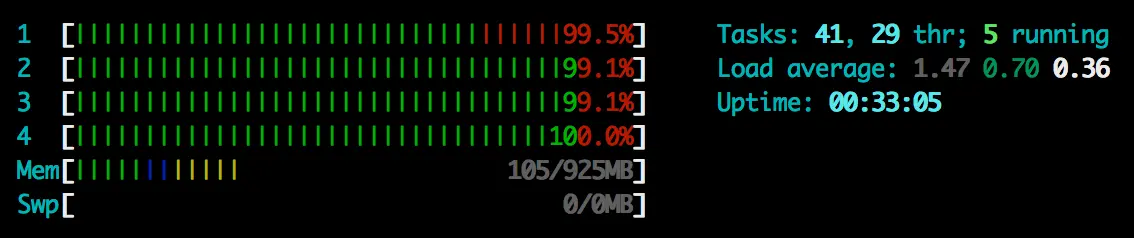
16 threads, 16 connections, static endpoint
➜  /  wrk -d 30 -c 16 -t 16 http://192.168.1.12:4001
Running 30s test @ http://192.168.1.12:4001
  16 threads and 16 connections
  Thread Stats   Avg      Stdev     Max   +/- Stdev
    Latency    22.68ms   72.52ms 809.18ms   97.75%
    Req/Sec    80.82     16.45   121.00     68.26%
  37831 requests in 30.05s, 166.12MB read
Requests/sec:   1259.11
Transfer/sec:      5.53MB
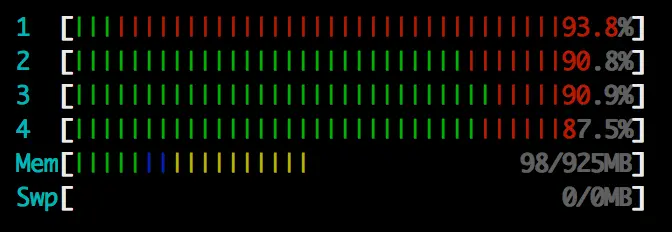
Now this time we're really close to maxing out the cores, but when I cranked it up to 32 connections and threads I notice no real improvement. Then it dawned on me that 6MB/sec is about the limit of my WiFi router.
At this point I tried to run wrk on the Pi, but ran into some compatibility errors, so I gave up. Then I remembered I had a Thunderbolt ethernet adapter, so I gave that a try. Turns out it wasn't the network limiting it, this was basically the best performance I could squeeze out of it.
8 threads, 8 connections with database and JSON rendering
➜  mfeckie.github.io git:(master) ✗ wrk -d 30 -c 8 -t 8 http://192.168.1.12:4001/api/standards
Running 30s test @ http://192.168.1.12:4001/api/standards
  8 threads and 8 connections
  Thread Stats   Avg      Stdev     Max   +/- Stdev
    Latency    37.43ms   10.05ms 252.77ms   87.10%
    Req/Sec    26.83      5.35    40.00     66.72%
  6469 requests in 30.10s, 27.96MB read
Requests/sec:    214.93
Transfer/sec:      0.93MB
Once we throw the database and JSON into the mix, we're asking it to do a LOT more work.
Enter the Erlang observer
I've posted previously about connecting the Erlang observer over SSH, so I'll use the techniques I outlined there to connect.
Once connected I ran a few of the tests again and made this video.
Here you'll get a feel for what's going on 'under the hood' when we try and stress the VM.
It's really nice to see how little memory is used by the application, peaking at around 80MB.
Without wish to be another language troll, this kind of performance with low resource requirements is unimaginable with many other web frameworks.