Debugging Broccoli and Ember-CLI
Recently I've been working on an extension to one of our products and we decided that we should explore using an Ember Engine to properly separate concerns and make the extension mountable in multiple places.
As part of the process we have plans to swap out several pieces in the future and I got to thinking about how we could write now in a way that would provide some good strategies to reduce the risk of breakage at that time.
As a result, I decided to add TypeScript to the project as it would allow us to define Interfaces that would ensure future changes implemented all the properties and methods that are needed. This hugely reduces the risk of missing a property (the importance of this will become apparent later).
The trouble is, both EmberEngines and the library I used for TypeScript are relatively young projects. As a result, I have run into a number of issues along the way that are the intersection of new(ish) libraries, my own ignorance and the complexity of modern build tooling.
Along the way I've spent quite a bit of time poking around in the internals of Ember-CLI, Ember-CLI-Typescript and Broccoli.js. I'll document the stuff I found out that was not immediately obvious and the stuff that I didn't seem to be able to find easily with my Google skill!
Learning about Ember-CLI's internals
So, Ember-CLI is a great tool that's really changed the way work on single page applications by automating a large number of decisions and allowing us to use 'modern' JavaScript techniques, before they've even been finalized / implemented in browsers.
This is incredibly powerful and the vast majority of the time, this makes our lives significantly easier.
When you encounter issues, however, there's a much larger challenge to figure out how to figure out what's going on!
How the hell do I pause this thing?
A tried an tested technique in JS development is the liberal application of debugger statements. Ember-CLI is written in JS, so we can just do the same thing there .. right? Wrong (kinda).
So if you were just doing this for a single .js file, you could start node like this node --inspect some-file.js. Sadly, this would probably result in your application exiting before you've even gotten chance to open the tooling. So you need to start it like this node --inspect --debug-brk some-file.js. This will immediately pause execution and give you chance go connect your dev tools.
The most developer friendly way (in my opinion) is to connect to the node instance using Chrome Dev Tools.
It turns out there's a relatively new way of doing this and it's AWESOME.
Chrome has a lovely new panel chrome://inspect which gives us the ability to open a dedicated window and have debugging sessions automatically intercepted for us.
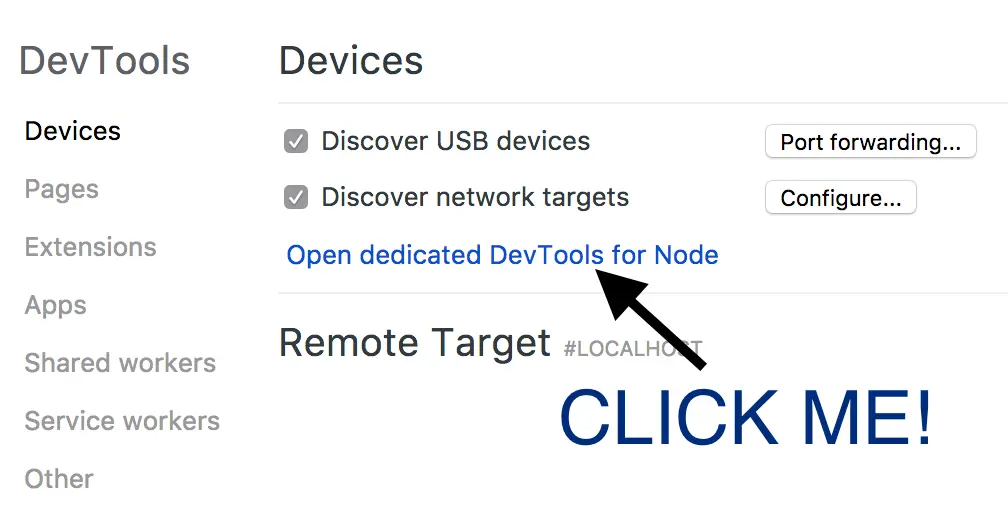
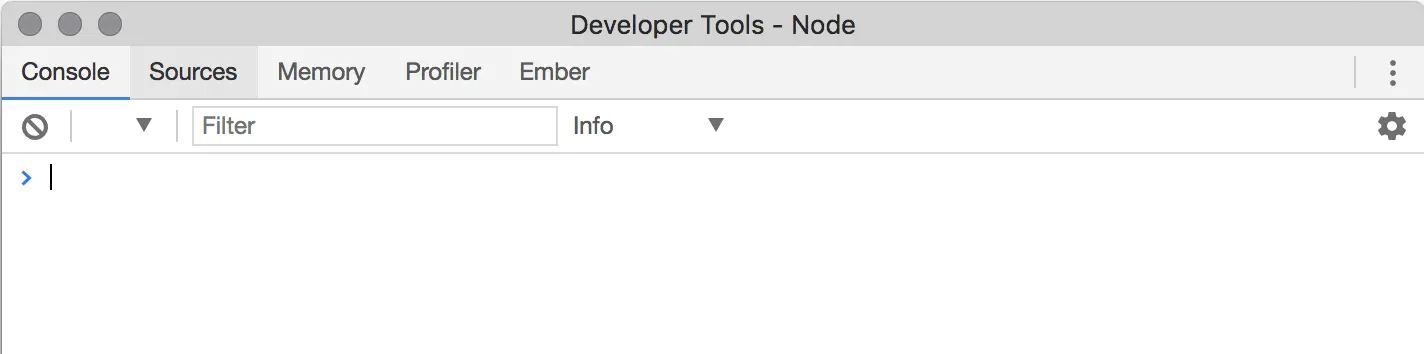
Using the Open dedicated DevTools for Node you get a shiny window that looks remarkably similar to the standard Chrome DevTools.
Now that we've got the ability to open node DevTools, how the hell do we get into Ember-CLI (ECLI)? Well, it's actually just a case of knowing where the tool lives node --inspect --debug-brk node_modules/ember-cli/bin/ember server With this, we can start ECLI and immediately pause it. It should be automatically intercepted by the dedicated DevTools window (I'm working on a Mac, your mileage may vary).
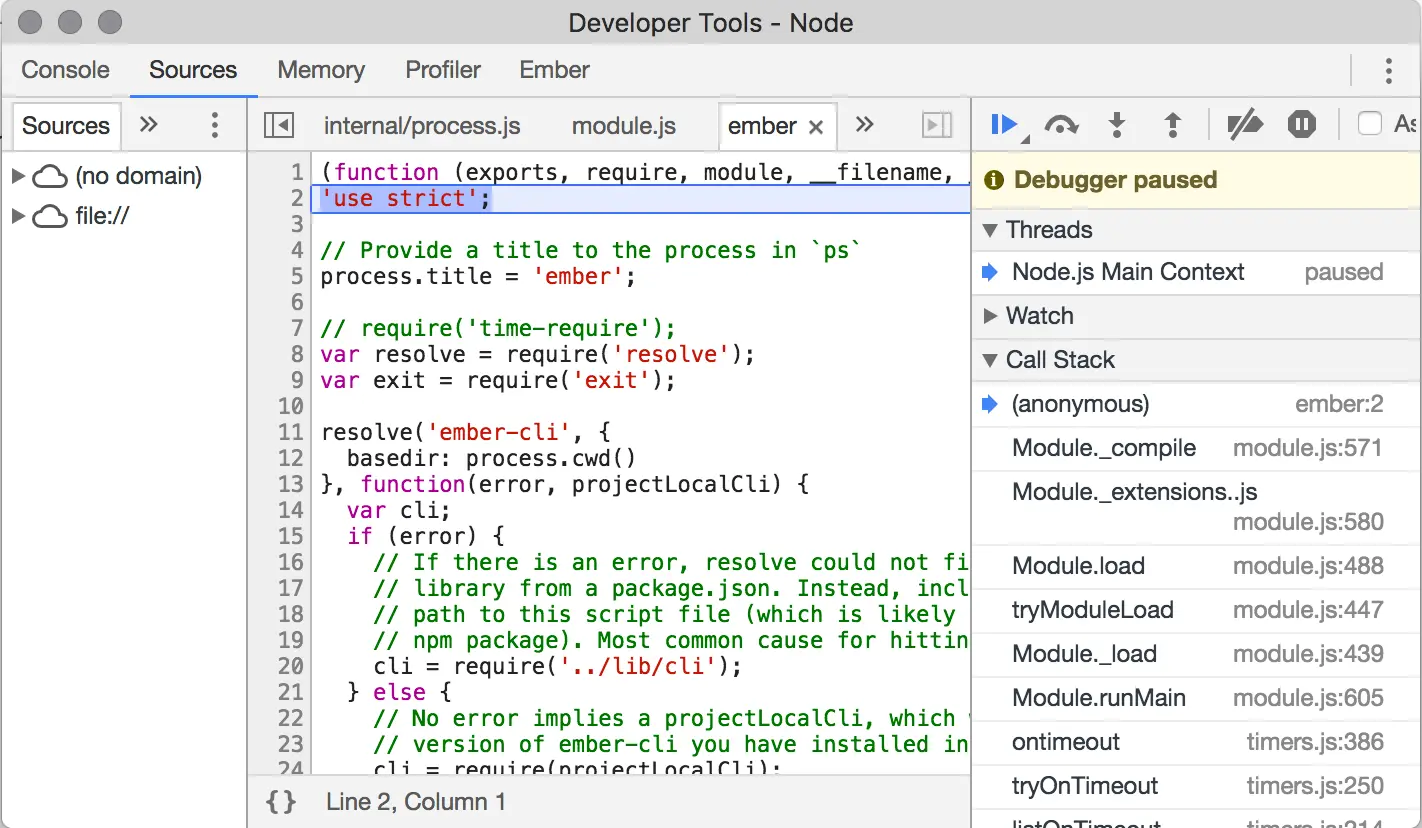
Boom!
OK, it's stopped! What now?
Now we know how to stop it, how can we do that in the places we need it to? Well that's a combination of detective work and hacking around.
What's very neat though, is you can open the source code for ECLI in the node_modules folder and add debugger statements as you need to.
For me, this was about exploring the various hooks and figuring out what I need to do to make things work the way I wanted.
And now for the TypeScript trick
After a little while working with ECLI-TypesScript, I contributed back to the project with some library updates and was happy when it was accepted and merged. Some other folks contributed too and a new release was made.
It was exciting because there were some useful speed improvements and a newer version of TypeScript, sadly, on updating my project all was sad in the world. No longer did the TypeScript get compiled :( .
I had some chats with the folks in Ember's Slack community and a number of people had ideas about what might be the problem and how I could explore.
Broccoli what?
After a bit of digging, I suspected that the problem was occurring here
  toTree(inputNode, inputPath, outputPath) {
    const js = funnel(inputNode, {
      exclude: ['**/*.ts'],
      annotation: 'JS files',
    });

    const debugTree = BroccoliDebug.buildDebugCallback('ember-cli-typescript');

    const uncompiledTs = debugTree(
      funnel(inputNode, {
        include: ['**/*.ts'],
        annotation: 'uncompiled TS files',
      }),
      `${this._tag}`
    );

    const ts = debugTree(
      tsc(uncompiledTs, {
        throwOnError: this.config.compilerOptions.noEmitOnError,
        annotation: 'Compiled TS files',
        include: ['**/*'],
        tsconfig: this.config,
      }),
      `${this._tag}`
    );

    // Put everything together.
    return mergeTrees([js, ts], {
      overwrite: true,
      annotation: 'merged JS & compiled TS',
    });
  }
}
This hook is called several times during the build process and passes a broccoli Node through a series of transformations, including the TypeScript compilation. So if I could throw in a debugger here I should be able to see what was going on.
I wanted to know what files were contained in the broccoli Node. Turned out that the property I thought most likely was always empty.
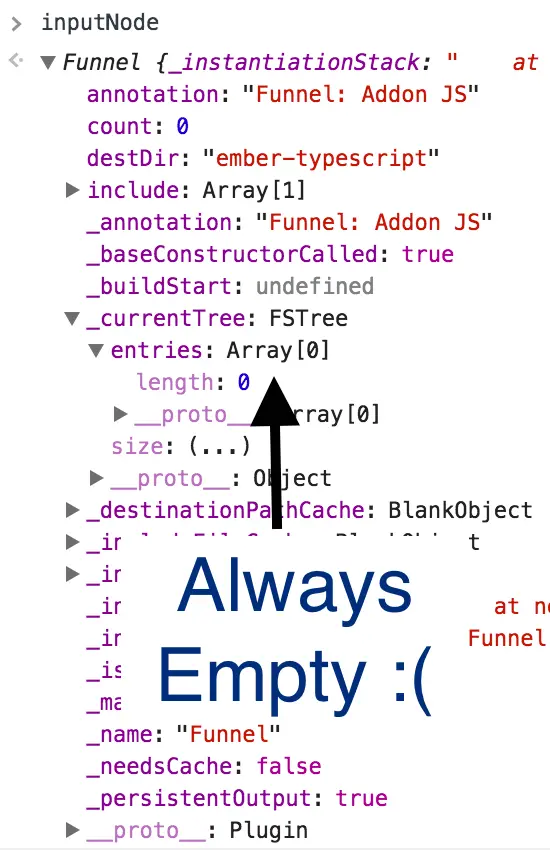
So Broccoli doesn't really do much with these Nodes until they are actually consumed, so there was no obvious way of printing out the contents.
I asked around on Slack and locks mentioned broccoli-stew.
After importing it, I could use it like this
  toTree(inputNode, inputPath, outputPath) {
    inputNode = stew.log(inputNode);
    const js = funnel(inputNode, {
      exclude: ['**/*.ts'],
      annotation: 'JS files',
    });
This results in the files being printed to the terminal as they are passed through the funnels.
[
  "ember-typescript/",
  "ember-typescript/components/",
  "ember-typescript/components/tsc-test/",
  "ember-typescript/components/tsc-test/component.js",
  "ember-typescript/config/",
  "ember-typescript/config/environment.js",
  "ember-typescript/engine.js",
  "ember-typescript/routes.js"
]
This indicated that there were no .ts files present in the input, which would obviously result in there being nothing for the TypeScript compiler to process.
I was then able to see that there was an include filter on the Node
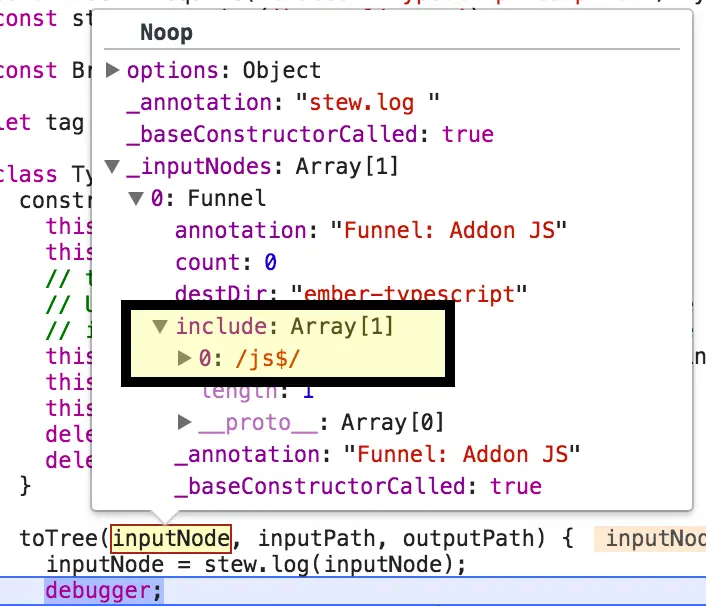
This indicated that only js files would be in the funnel.
After a spot more digging, I eventually found my way to the Ember Addon Hooks API where I noticed that when setting up a preProcessorRegistry entry, there was a ext property, which looked suspiciously like a file extension!
class TypeScriptPreprocessor {
  constructor(options) {
    this.name = 'ember-cli-typescript';
    this._tag = tag++;
    this.ext = 'ts';
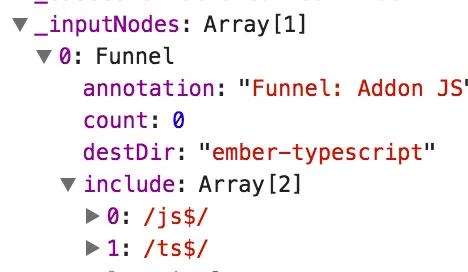
I added this to the constructor and could now see that .ts files now appeared in the tree!
[
  "ember-typescript/",
  "ember-typescript/components/",
  "ember-typescript/components/tsc-test/",
  "ember-typescript/components/tsc-test/component.js",
  "ember-typescript/config/",
  "ember-typescript/config/environment.js",
  "ember-typescript/engine.js",
  "ember-typescript/lib/",
  "ember-typescript/lib/example.ts",
  "ember-typescript/routes.js"
]
And in the inputNode we now have .ts files as well.
(Good) PR
Now that I knew how to fix the problem, I created a Pull Request back to the library and the owner merged it soon after.
It was a pretty interesting experience and what I share here is the condensed version with all of the desperation, swearing and dead ends removed!
All of the folks from the library maintainer to the people I chatted with on Slack were super helpful. All of the libraries have pretty good documentation and most of the things I've documented here are well known by people who work on the build tooling regularly. For us lesser mortals, however, hopefully this summary will help the next person who googles for 'How to debug ember build process?'.
And in a supreme piece of universe trolling ... if there were a PreProcessor Interface, we could do this
interface PreProcessor {
  name: string
  ext: string,
}

class TypeScriptPreprocessor implements PreProcessor {
  name = 'ember-cli-typescript'
}
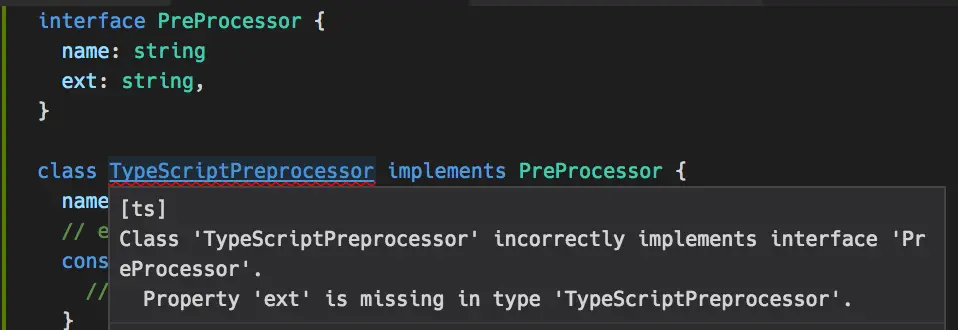
And would be warned of the mistake!
So despite the long journey, it ended up reinforcing my belief that utilising TypeScript has the potential to reduce the risk of making mistakes on a long term basis!